HMO investment Birmingham: the market in context
This HMO investment Birmingham guide starts with the sale market, and it is a big one. Our snapshot counts 7,055 active sale listings across 39 outcodes, with a listings-weighted average asking price of £242,790 and a blended gross yield of 6.6%. Those numbers are the backdrop. Whether a particular house can operate as an HMO depends on planning and licensing, and in Birmingham the planning question comes first.
Be clear about what these figures are. The asking prices cover all homes listed for sale, not only houses suited to shared living. The yield is a gross figure built from standard rental listings, so it reflects whole-property rents rather than rooms let one by one. An HMO let by the room earns a different rent. It also costs a great deal more to run. Treat the blended figure as a market reference point, not an HMO return.
Town figures are blended across the outcodes covered, which smooths over large differences between neighbourhoods. On a specific street, the district view below matters more than the citywide average. The full outcode breakdown sits on our Birmingham market data page.
Prices and yields across the city
The weighted average asking price of £242,790 hides a wide spread. The table ranks every outcode by the number of active listings, so the busiest markets appear first rather than the cheapest or the highest yielding.
| Rank | Outcode | Area | Median asking price | Listings | Gross yield | Sold price change (12 months) |
|---|---|---|---|---|---|---|
| 1 | B1 | England | £190,000 | 562 | 7.0% | -4.0% |
| 2 | B16 | England | £185,000 | 413 | 7.7% | 3.1% |
| 3 | B31 | England | £260,000 | 398 | 5.8% | 1.5% |
| 4 | B15 | England | £225,000 | 391 | 6.3% | 27.7% |
| 5 | B5 | England | £210,000 | 350 | 6.9% | -4.8% |
| 6 | B23 | England | £205,000 | 313 | 7.0% | 3.9% |
| 7 | B13 | England | £245,000 | 309 | 6.2% | 9.6% |
| 8 | B17 | England | £350,000 | 296 | 5.0% | 6.1% |
| 9 | B26 | England | £265,000 | 259 | 6.3% | 4.8% |
| 10 | B29 | England | £297,500 | 246 | 6.0% | 6.0% |
| 11 | B14 | England | £280,000 | 243 | 5.5% | -1.2% |
| 12 | B32 | England | £250,000 | 232 | 6.1% | 8.7% |
| 13 | B28 | England | £325,000 | 219 | 5.4% | -2.0% |
| 14 | B45 | England | £295,000 | 213 | 5.3% | -3.6% |
| 15 | B3 | England | £180,000 | 212 | 8.2% | 14.3% |
| 16 | B24 | England | £260,000 | 198 | 6.4% | -4.4% |
| 17 | B12 | England | £190,000 | 188 | 7.3% | -14.3% |
| 18 | B4 | England | £260,000 | 186 | 6.1% | n/a |
| 19 | B30 | England | £262,500 | 164 | 6.0% | -1.0% |
| 20 | B42 | England | £240,000 | 152 | 6.0% | 2.0% |
| 21 | B44 | England | £220,000 | 149 | 6.7% | 3.4% |
| 22 | B36 | England | £325,000 | 143 | 5.2% | 1.2% |
| 23 | B11 | England | £224,750 | 128 | 6.3% | 4.8% |
| 24 | B20 | England | £320,000 | 125 | 6.0% | 10.6% |
| 25 | B38 | England | £270,000 | 122 | 5.7% | 7.8% |
| 26 | B27 | England | £265,000 | 113 | 6.3% | 7.0% |
| 27 | B18 | England | £179,000 | 101 | 7.6% | -5.6% |
| 28 | B33 | England | £227,500 | 98 | 6.7% | 7.3% |
| 29 | B21 | England | £199,975 | 82 | 6.5% | 5.1% |
| 30 | B8 | England | £230,000 | 77 | 6.6% | 0.5% |
| 31 | B34 | England | £230,000 | 68 | n/a | 0.0% |
| 32 | B10 | England | £242,500 | 52 | n/a | 8.6% |
| 33 | B9 | England | £230,000 | 52 | 7.2% | -6.2% |
| 34 | B25 | England | £225,000 | 47 | 6.6% | -8.3% |
| 35 | B19 | England | £200,000 | 41 | 6.1% | 5.9% |
| 36 | B2 | England | £175,000 | 39 | 7.2% | n/a |
| 37 | B6 | England | £200,000 | 37 | n/a | 0.0% |
| 38 | B35 | England | £210,000 | 29 | n/a | 2.6% |
| 39 | B7 | England | £182,500 | 8 | n/a | n/a |
Sold prices are mixed. Of the 36 outcodes with a sold-price change figure, 23 show rising prices and 11 show falling prices over the latest year compared with the one before. The strongest outcode recorded a change of 27.7%. That comparison uses medians of established homes on standard sales within a set price band, and an outcode needs enough sales in both periods to qualify. In prime areas where many homes sell above the band, read the figure as a lower bound.
 100%; height: auto; border-radius: 8px; margin: 8px 0;" />
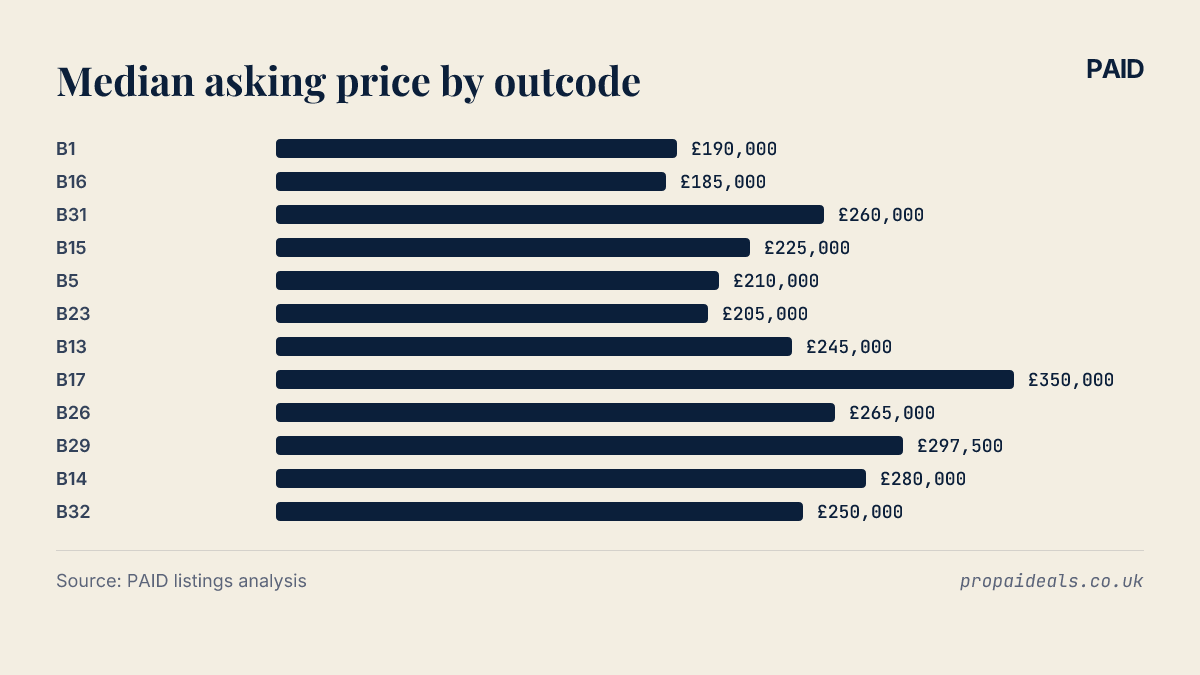
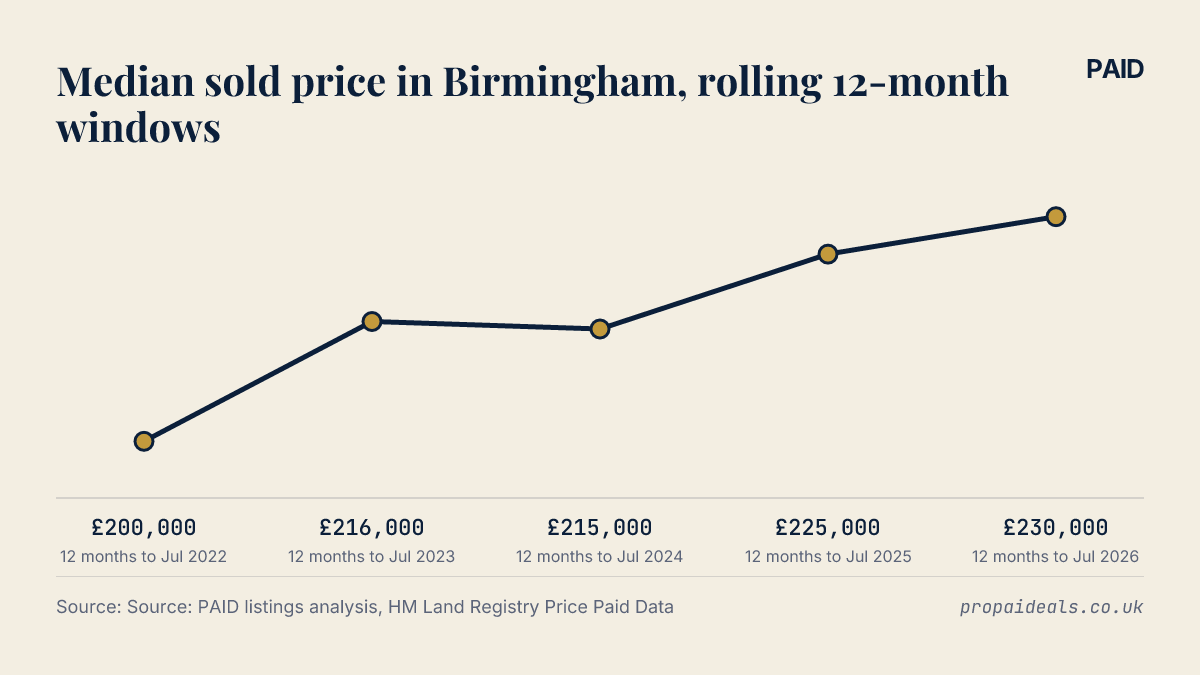
The chart shows median asking prices in the outcodes with the most listings. The trend below tracks the median sold price for Birmingham across rolling yearly windows, using official sold-price records. Windows end a little before the data date because sales are registered late, and any window with too few sales is left out.
 100%; height: auto; border-radius: 8px; margin: 8px 0;" />
| Period | Median sold price | Sales |
|---|---|---|
| 12 months to Jul 2022 | £200,000 | 9,610 |
| 12 months to Jul 2023 | £216,000 | 8,510 |
| 12 months to Jul 2024 | £215,000 | 7,661 |
| 12 months to Jul 2025 | £225,000 | 8,852 |
| 12 months to Jul 2026 | £230,000 | 7,078 |
Planning permission and the citywide Article 4 direction
Across England, turning a family house into a small HMO is normally permitted development, which means no planning application is needed. An Article 4 direction removes that right for a defined area. Once it applies, the change of use needs full planning permission.
Birmingham has a citywide Article 4 direction covering small HMOs. For a small HMO, Birmingham Article 4 rules mean converting an ordinary house anywhere in the city needs planning permission. Check the city council's own pages for the current wording and the date it took effect before relying on any summary, this one included.
Larger HMOs fall outside the small HMO use class and generally need planning permission wherever they are, direction or not. So the direction mainly changes the position for smaller conversions. Those were the ones that used to go ahead without an application.
When an application is made, the council assesses it against local planning policy. That policy can weigh how many HMOs already exist nearby, the effect on neighbours, parking, refuse storage and the quality of the accommodation. Read the current HMO policy in full. It is the test an application will face.
Buying an existing HMO raises a different question. A property lawfully in HMO use before the direction came in may be able to carry on, but you need evidence of that lawful use. A certificate of lawfulness, or a planning permission for the HMO use, gives far more certainty than a seller's word or an old stack of room adverts.
Mandatory and additional licensing
Licensing is a separate regime. Planning decides whether a building may be used as an HMO. Licensing decides whether a particular landlord may run it, and on what conditions. Holding one does not mean you hold the other, and many HMOs need both.
Mandatory licensing applies nationally to larger HMOs that meet the threshold set in housing law. A Birmingham HMO licence for those properties is issued by the city council, which checks that the landlord or manager is a fit and proper person and that the property meets standards on room sizes, kitchen and bathroom facilities, and fire safety.
Councils can also bring in additional licensing schemes that pull smaller HMOs into licensing in designated areas, and selective licensing schemes that cover other private rented homes. These schemes are time limited. Their boundaries change. Check the council's current position for the exact address rather than assuming a smaller HMO is exempt.
Licences carry conditions for as long as the property is let, including gas and electrical safety, fire alarms, waste arrangements and management standards. Running a licensable HMO without a licence can lead to civil penalties, prosecution and orders to repay rent. The licensing status of any HMO you look at deserves the same scrutiny as its planning history.
Where HMO demand comes from
HMO tenants are people who want or need a room rather than a whole home. In general that includes students, young workers early in their careers, people who have moved to a city for a job, and anyone for whom a self-contained flat costs more than they can or want to pay.
The figures in this article do not measure room demand. They cover asking prices, whole-property rents and sold prices, so we do not tie any outcode's yield or price movement to a particular tenant group. A strong gross yield in an outcode is not proof that rooms let quickly there.
That makes room demand a street-level test. Count the rooms advertised nearby and note how long they stay up. Compare the rents asked for similar rooms, with bills included or not. Talk to the agents who manage shared houses in that patch about voids at the changeover points in the year. And watch new supply, because purpose-built accommodation competes for the same tenants and can change a patch quickly.
A checklist before you buy an HMO
The checks below describe what to establish about any prospective HMO. They are not a recommendation to buy one.
Start with planning. Confirm whether the property already has lawful HMO use and how that is evidenced. If it does not, read the council's HMO policy, judge whether an application would meet it under the citywide Article 4 direction, and think about how long a refusal or appeal would leave the house earning nothing.
Then licensing. Establish whether the property needs a mandatory licence, whether an additional or selective scheme covers the address, and whether an existing licence can transfer. Ask to see the current licence and its conditions.
Next, the building. Measure the bedrooms against the council's minimum room sizes, check fire doors, alarms and escape routes, and count bathrooms and kitchen space against the standards for the planned number of occupants. Bringing a house up to standard can change the numbers a lot. The surprises are rarely cheap.
Finance and insurance come after that. Lenders and insurers treat HMOs differently from single lets, and their terms affect costs from day one.
Finally, work out net figures. Gross yield flatters an HMO more than most lets. The landlord usually pays utility bills, council tax, broadband, cleaning of shared areas and licence fees, and repairs come round more often when several unrelated adults share a kitchen. Voids work per room. An empty room is a cost you carry while the rest of the house keeps paying. Set your own net estimate beside the area data on the Birmingham market data page.
You can browse investment properties to see what is listed now, and our guides cover yields, licensing and due diligence in more depth.

