How we ranked rental yields by postcode
Rental yields by postcode run highest in TS1, where the gross yield on current listings is 10.0%. Across the 20 postcode districts in our ranking, the median sits at 8.6%, so the leaders are tightly bunched. The rest of this article shows where those districts are and what the figures can and cannot tell you.
We worked from live sale and rental listings as they stood in October 2026. For each postcode district (the outward half of a postcode, sometimes called an outcode) we compared typical asking rents with typical asking prices. Gross yield is the annual rent divided by the purchase price. No costs come off.
A district only made the table if it had enough listings on both the sale side and the rental side to give a stable reading. Small samples can throw up extreme yields from a handful of unusual properties, so districts with thin markets were left out. The Listings column shows how deep each sample is. It varies more than the yields do.
Two caveats matter. These are asking figures, so agreed rents and completed sale prices may differ. And this is a ranking of the leading districts, not a census of every postcode, which means the median here describes the top slice rather than the country as a whole.
| Rank | Outcode | Area | Gross yield | Listings |
|---|---|---|---|---|
| 1 | TS1 | England | 10.0% | 158 |
| 2 | GU30 | England | 9.3% | 146 |
| 3 | LS2 | England | 9.2% | 127 |
| 4 | DL4 | England | 9.1% | 97 |
| 5 | BD1 | England | 9.1% | 123 |
| 6 | G1 | Scotland | 9.1% | 128 |
| 7 | PA15 | Scotland | 9.0% | 53 |
| 8 | NE1 | England | 9.0% | 216 |
| 9 | WV1 | England | 8.9% | 82 |
| 10 | AB11 | Scotland | 8.7% | 108 |
| 11 | SR8 | England | 8.6% | 255 |
| 12 | LE1 | England | 8.6% | 324 |
| 13 | AB25 | Scotland | 8.6% | 64 |
| 14 | TS3 | England | 8.6% | 143 |
| 15 | G31 | Scotland | 8.4% | 72 |
| 16 | YO21 | England | 8.4% | 390 |
| 17 | G52 | Scotland | 8.4% | 36 |
| 18 | L7 | England | 8.4% | 118 |
| 19 | S1 | England | 8.4% | 205 |
| 20 | CF10 | Wales | 8.4% | 368 |
The top of the table and where the leaders cluster
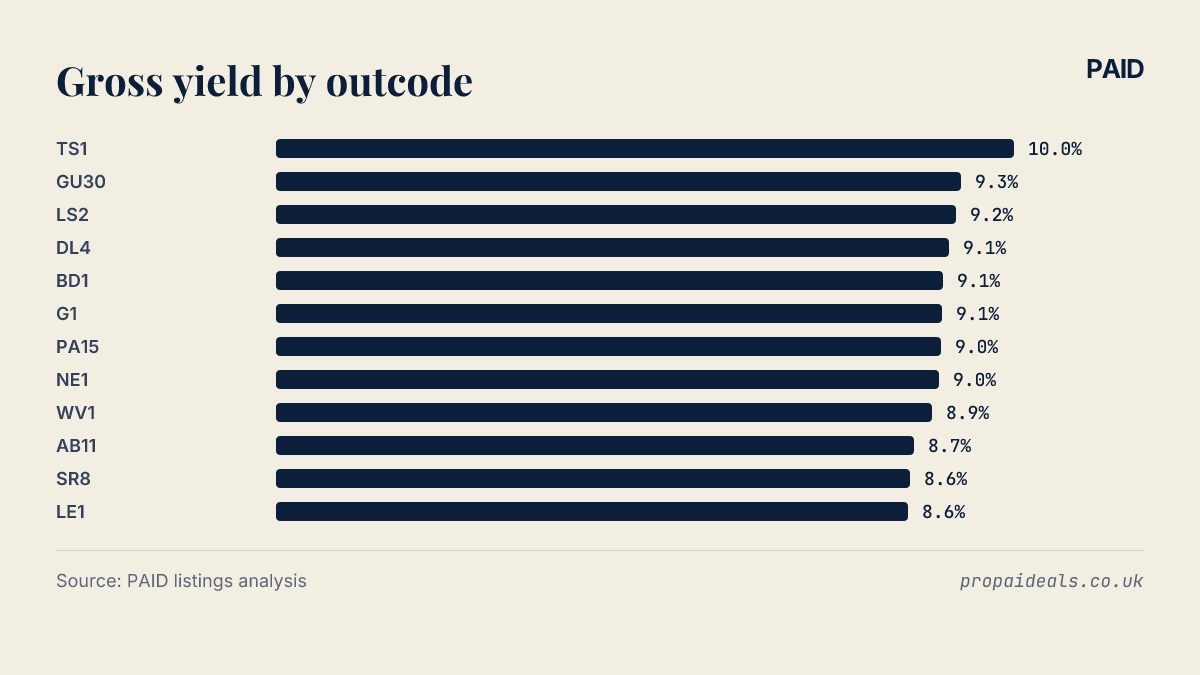
The highest yielding postcodes in the UK on this measure start with TS1 at 10.0%. Behind it, GU30 records 9.3% and LS2 records 9.2%. The lead at the very top is the clearest gap anywhere in the list.
After that the figures flatten out. DL4 sits at 9.1%, level with BD1 and G1. PA15 and NE1 both come in at 9.0%, followed by WV1 at 8.9% and AB11 at 8.7%.
So, where are rental yields highest? On this data, mostly in the north of England and Scotland. The exceptions are few: WV1 in the West Midlands, LE1 in the East Midlands and CF10 in Wales. GU30 is the geographic outlier, a district in the south of England sitting near the top of a list otherwise drawn from further north.
A good share of the districts are the central postcodes of large towns and cities. The data does not tell us why, and reading a single cause into it would be a mistake. What it does show is that the table is not one region's story.
 100%; height: auto; border-radius: 8px; margin: 8px 0;" />
The middle of the market and the typical yield
The median gross yield in the ranking is 8.6%. SR8, LE1, AB25 and TS3 all sit at that level, so the middle of the table is a cluster rather than a single district.
The foot of the table is close behind. The lowest yield in the ranking is 8.4%, shared by every district from G31 down to CF10. Put simply, the distance from the leader to the median is much wider than the distance from the median to the bottom.
That shape matters. Outside the very top, the differences between districts are small enough that a few months of price or rent movement could reshuffle the order. Read the yield band, not the rank number.
Sample depth also varies across the middle and lower rows. YO21 and CF10 rest on some of the largest listing counts in the table, while G52 rests on a much smaller one. A yield drawn from a deep pool of listings is a firmer reading than the same yield from a shallow one.
Why the highest yields often come with higher risk
Gross yield is a ratio, and a ratio can rise for two different reasons. Rents can be high relative to prices, or prices can be low relative to rents. The headline number looks the same either way. The investment behind it may not.
Gross yield also ignores everything that happens after the rent is agreed. Letting and management fees come out of it. So do insurance, repairs and periods with no tenant, and arrears and licensing costs sit on top of those. One empty month and a replacement boiler in the same year will take a visible bite out of any gross figure. Two districts with the same gross yield can produce quite different net returns once those costs are counted.
Capital value is the other half of total return. A gross yield says nothing about whether prices in a district have risen or fallen over time, or how quickly a property could be sold if needed. Some investors accept a lower yield in exchange for steadier values, and others accept more volatility for more income. The ranking does not settle that trade off.
There is a measurement point too. Asking prices on cheaper stock can be negotiated down, which would push the achieved yield higher, while advertised rents are not always what tenants end up paying. Neither effect shows up in a listings based snapshot.
How to use the ranking when you shortlist an area
Lists of the best postcodes for buy to let usually rank on gross yield alone. This table does the same. That makes it useful as a first filter and limited as anything more: it tells you where the ratio of rent to price looks strong on current listings, and nothing else.
The obvious next step is to test each district against figures the table does not hold. That means sold prices rather than asking prices, achieved rents, likely running costs and any local licensing scheme. Check the Listings column as well, because a district with a shallow sample deserves more scrutiny before its yield is taken at face value.
Street level matters more than the district average. A postcode district can contain very different streets and property types, and the average yield may not describe the property in front of you.
To see how individual properties compare with these district figures, you can browse investment properties. For more on how yield, costs and financing fit together, see our guides.
