What the price reduction share measures
Price reductions by area are most visible in WC1N, where 46.7% of active listings have had their asking price cut in the last ninety days. We ranked 20 postcode districts across the UK with the highest shares, and the median district in that ranking sits at 36.7%. If you want to know where sellers are rethinking their opening price most often, this is the list.
The measure is simple. For each postcode district, we take the active listings on the portal feeds we track and work out what share had their asking price reduced in the last ninety days. It is a proportion, not a total. A busy district and a quiet one sit on the same scale.
That simplicity has a cost. A share tells you how often sellers cut, not how deeply. A district where most reductions are small can rank above one where fewer sellers cut but by much more, and a district with a modest number of listings can swing a long way on a handful of reductions.
Price reductions by area: the districts with the highest share
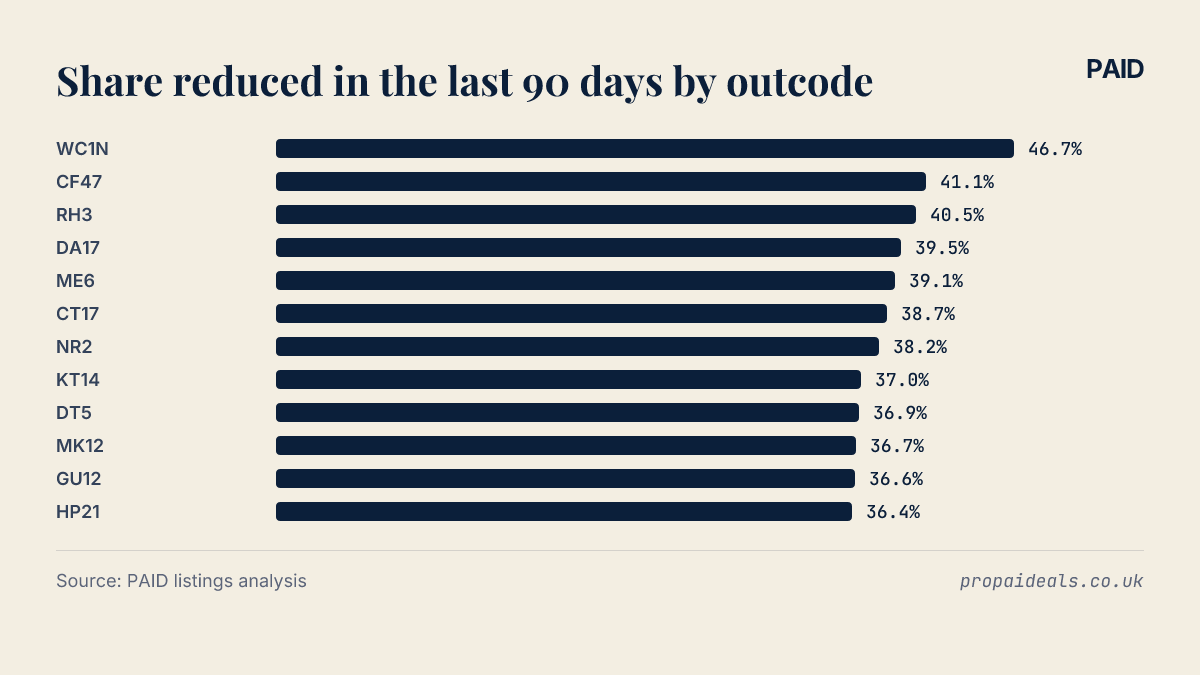
WC1N leads the ranking at 46.7%. CF47 follows at 41.1%, with RH3 close behind on 40.5%. After that the figures tighten: DA17 records 39.5% and ME6 39.1%.
| Rank | Outcode | Area | Share reduced in the last 90 days | Listings |
|---|---|---|---|---|
| 1 | WC1N | England | 46.7% | 60 |
| 2 | CF47 | Wales | 41.1% | 146 |
| 3 | RH3 | England | 40.5% | 42 |
| 4 | DA17 | England | 39.5% | 129 |
| 5 | ME6 | England | 39.1% | 138 |
| 6 | CT17 | England | 38.7% | 243 |
| 7 | NR2 | England | 38.2% | 283 |
| 8 | KT14 | England | 37.0% | 173 |
| 9 | DT5 | England | 36.9% | 206 |
| 10 | MK12 | England | 36.7% | 79 |
| 11 | GU12 | England | 36.6% | 243 |
| 12 | HP21 | England | 36.4% | 280 |
| 13 | NR5 | England | 36.4% | 264 |
| 14 | SM2 | England | 36.3% | 289 |
| 15 | SM7 | England | 36.3% | 245 |
| 16 | WV2 | England | 36.2% | 58 |
| 17 | RH2 | England | 36.2% | 337 |
| 18 | OL13 | England | 36.2% | 141 |
| 19 | BS36 | England | 36.1% | 83 |
| 20 | KA21 | Scotland | 36.1% | 61 |
 100%; height: auto; border-radius: 8px; margin: 8px 0;" />
The chart makes the shape clearer. There is a visible step between the leader and the next few districts. Then the bars flatten out.
The typical share across the country
The median share across the ranked districts is 36.7%, the same figure recorded in MK12. The lowest share in the ranking is 36.1%, in KA21. This median describes the districts in the ranking, not every district in the country. Because these are the places with the highest shares, a typical figure for the whole country would sit lower, and the pack does not give one.
The lower half is flat. HP21 and NR5 record the same share, 36.4%, and SM2 and SM7 also tie, at 36.3%. When neighbouring rows are this close, the exact order says very little. Treat the bottom of the list as a group.
For anyone tracking asking price cuts in the UK at district level, that matters. A move of a place or so in this part of the table could come from a few listings changing status, not from any real shift in the local market.
What a high share means for negotiating
A high share shows that, in that district, sellers have more often found their opening asking price did not hold. For a buyer that is useful context. The first figure on a listing is less likely to be the final word, and a reduction on the property you are viewing would not be unusual for the area.
It does not tell you what any single seller will accept. Each listing has its own history. How long a specific property has sat on the market, and whether its own price has already moved, tells you more than the district figure ever will.
From a landlord's side, a cheaper purchase is only half the sum. Refurbishment, letting fees and a void month or two between tenants can eat a modest discount quickly, so the asking price cut is a starting point for the numbers rather than the answer.
People searching for buyers market areas in the UK often want a definitive list. This ranking is narrower. It shows where sellers have most visibly adjusted asking prices recently, and sale prices, time on market and rental demand all sit outside it.
If you are comparing districts, you can browse investment properties or read our guides on how to assess an area before making an offer.
Limits of listings data on price cuts
The definition matters, so here it is exactly. The figure is the share of active listings whose asking price was cut in the last ninety days, on the portal feeds we track. Reductions are recorded mainly on one portal's feed, so an outcode with more of its stock listed there shows a higher share.
Part of a district's position can therefore reflect where its sellers list, not only how often they cut. Read the ranking as where cuts are visible, not a precise count.
Asking prices are not sale prices either. A reduction tells you a seller lowered their expectation. It does not tell you what the property eventually sold for, or whether it sold at all. The data is a snapshot taken in October 2026, and shares in individual districts can change quickly as listings come and go.

