The method and the sample floors behind the ranking
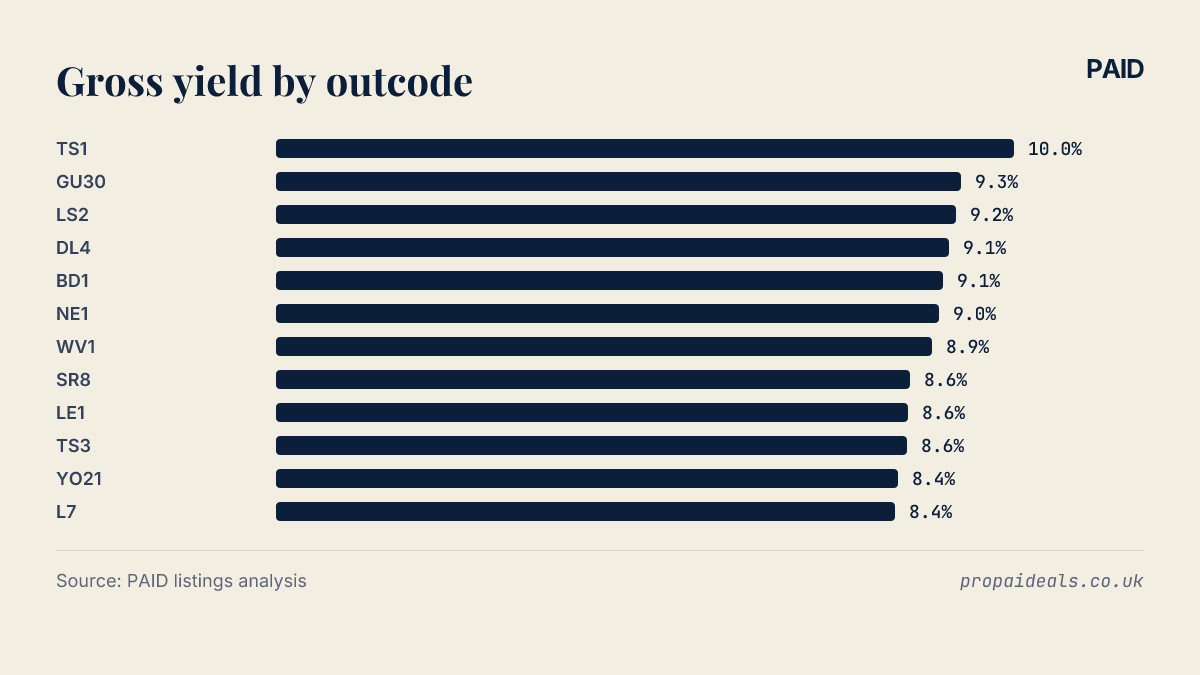
The highest yielding postcodes in England are led by TS1, where the gross rental yield from live listings reaches 10.0%. We ranked 20 postcode districts across England, and the median yield among them is 8.5%. Nearly all of the leaders sit in the North and the Midlands.
Gross yield here is the annual asking rent divided by the asking price, worked out for each outcode from properties currently listed for sale and to let. It is a blunt measure. It ignores costs and voids, and it uses asking figures rather than agreed ones. Treat it as a screen.
The ranking applies sample floors. A district only enters the table if it has enough sale listings and enough rental listings to give a stable median. Without that rule, a handful of cheap flats and a couple of optimistic rental adverts can push a tiny market to the top, and the resulting figure tells you almost nothing.
The Listings column in the table below shows how many listings sit behind each district's figure. Samples vary a lot. The same yield can rest on very different amounts of evidence, so it pays to read that column alongside the yield. The data reflects listings as of October 2026.
Which districts lead the highest yielding postcodes in England
| Rank | Outcode | Area | Gross yield | Listings |
|---|---|---|---|---|
| 1 | TS1 | England | 10.0% | 158 |
| 2 | GU30 | England | 9.3% | 146 |
| 3 | LS2 | England | 9.2% | 127 |
| 4 | DL4 | England | 9.1% | 97 |
| 5 | BD1 | England | 9.1% | 123 |
| 6 | NE1 | England | 9.0% | 216 |
| 7 | WV1 | England | 8.9% | 82 |
| 8 | SR8 | England | 8.6% | 255 |
| 9 | LE1 | England | 8.6% | 324 |
| 10 | TS3 | England | 8.6% | 143 |
| 11 | YO21 | England | 8.4% | 390 |
| 12 | L7 | England | 8.4% | 118 |
| 13 | S1 | England | 8.4% | 205 |
| 14 | S3 | England | 8.4% | 253 |
| 15 | BD3 | England | 8.4% | 47 |
| 16 | DN1 | England | 8.2% | 84 |
| 17 | B3 | England | 8.2% | 212 |
| 18 | NE8 | England | 8.1% | 201 |
| 19 | NG7 | England | 8.1% | 484 |
| 20 | TS4 | England | 8.1% | 109 |
DL4 and BD1 sit level at 9.1% and 9.1% respectively. NE1 comes next at 9.0%, with WV1 on 8.9%.
 100%; height: auto; border-radius: 8px; margin: 8px 0;" />
Below that, the figures bunch tightly. SR8, LE1 and TS3 all record 8.6%, and a run of districts including YO21, L7, S1, S3 and BD3 share 8.4%. The table closes with NE8, NG7 and TS4 at 8.1%.
A list of the best buy to let postcodes in England is easy to read as a league table where every place matters. This one does not work like that. The distance from the median at 8.5% down to the bottom at 8.1% is small, and positions in the lower half could reshuffle on a few new listings.
The regional pattern in the top of the table
The geography is consistent. Teesside appears repeatedly, with TS1, TS3 and TS4 all in the table. Yorkshire is well represented through LS2, BD1, BD3, S1, S3, YO21 and DN1.
The wider North East adds NE1, NE8, SR8 and DL4. The Midlands contributes WV1, LE1, B3 and NG7, while the North West appears through L7.
Many of these are city centre districts. That affects how you read them, because a central outcode's listings can look quite unlike those in the suburbs a mile or two away.
The exception is GU30, a Hampshire district in the South East, at 9.3%. Nothing else in the table comes from the south. An outlier like this needs a look at the underlying listings before anyone reads it as a regional shift.
In general terms, yield rises wherever rents are high relative to prices. A district can top a yield table because rents are strong, because prices are low, or through a mix of both. The ranking alone does not show which applies in any given place.
What sits behind a very high yield
A high gross figure is where the checking starts. The most common distortion in listings data is the mix of property types. If a district's sale listings lean towards small flats while its rental listings include larger homes, or rooms let individually in shared houses, the ratio of rent to price can look stronger than any single property would deliver.
Gross yield also ignores costs, and they add up faster than most spreadsheets admit. Flats can carry service charges and ground rent. Older stock tends to need more maintenance. Some councils require a licence for certain rented properties, which brings fees and standards to meet. Then come letting fees and insurance. Voids are the cost that most often gets left out of a quick sum, and a couple of empty months wipes out a surprising share of a year's rent.
Asking prices and asking rents are not completed figures either. Sale prices may settle below the asking level, which would lift real yields. Rents can be negotiated down too, which would lower them. The direction of the error is not fixed, and it moves by district and by season.
Questions to ask before buying in a leading district
Start with the sample. How many listings sit behind the figure, and are they spread across the district or clustered in one building or development? A deep sample with a modest yield often tells you more than a shallow one with a striking yield.
Then look at what the listings actually are. Are the rental adverts for whole properties or for rooms? Do the sale listings include auction lots or homes needing major work? Those drag the price median down, and the yield up with it.
Work out the running costs for the property type in question. For flats, the lease length and the service charge history are the first things to pull. For houses, check whether the council operates a licensing scheme that would apply.
Finally, compare the district with its neighbours. If an outcode's yield sits well above the surrounding districts, the reason should be visible in the listings. If it is not, be sceptical of the figure. Our guides cover how to get from gross to net yield, and you can browse investment properties to see the kind of listings that feed figures like these.
