What the Budget changed for landlords
The landlord tax rise in the Budget on 28 October is the second in two years. From 6 April 2027, rental profit will be taxed at 24% for basic rate payers, 44% at the higher rate and 49% at the additional rate. The rates apply across England, Wales and Northern Ireland.
Today a landlord pays the ordinary income tax rates of 20%, 40% and 45% on rental profit. Last year's Budget had already set separate property rates of 22%, 42% and 47% from April 2027. This Budget adds 2 more percentage points to each, so the rise from today is 4 points in every band.
Because every band moves by the same amount, the extra bill depends on how much profit a landlord makes, not on which band they sit in. Each £1,000 of rental profit will cost £40 more in tax a year.
The landlord tax rise on a typical rent
To turn that into pounds we took the typical asking rent for a two-bedroom home in each postcode district, leaving out room lets. A district is the first half of a postcode, the part before the space. Across the 1,860 districts in England and Wales with enough listings, the middle figure is £1,100 a month.
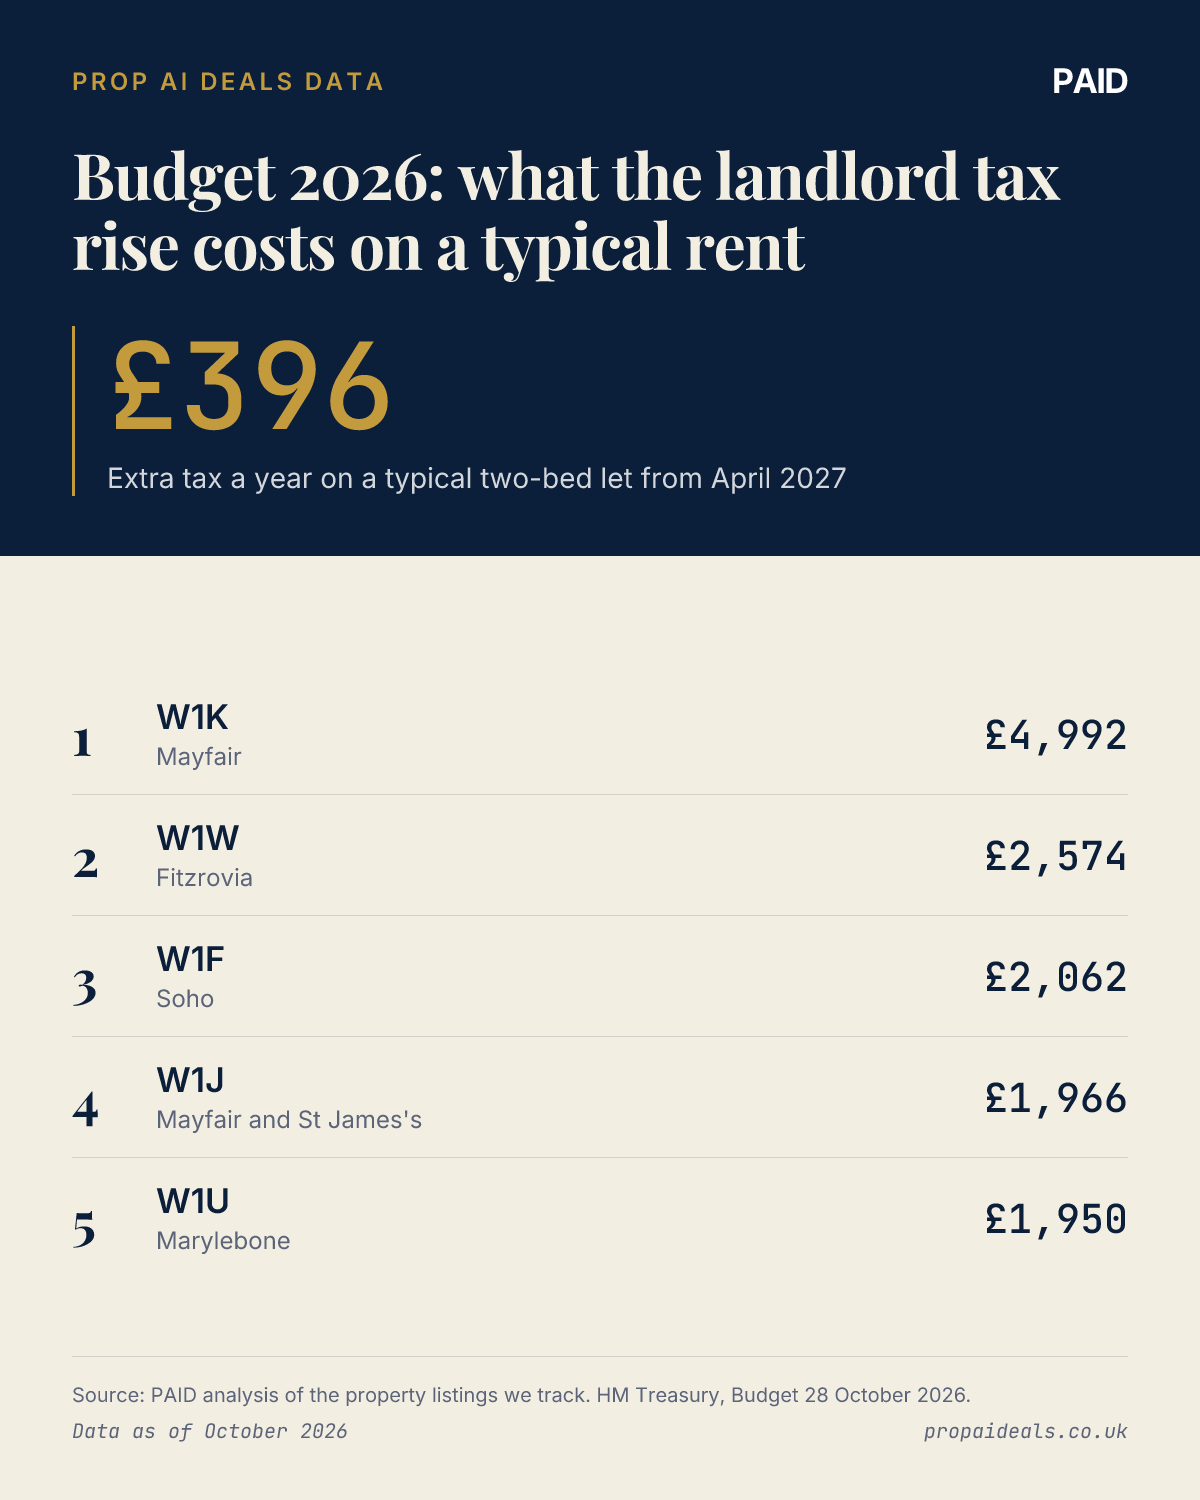
We assumed the landlord owns the home outright and that a quarter of the rent goes on letting fees, repairs, insurance and other running costs. On that basis the typical two-bed landlord pays £396 more tax a year from April 2027 than today. Of that, £198 comes from this Budget. The rest was already law.
Where the rise costs landlords most
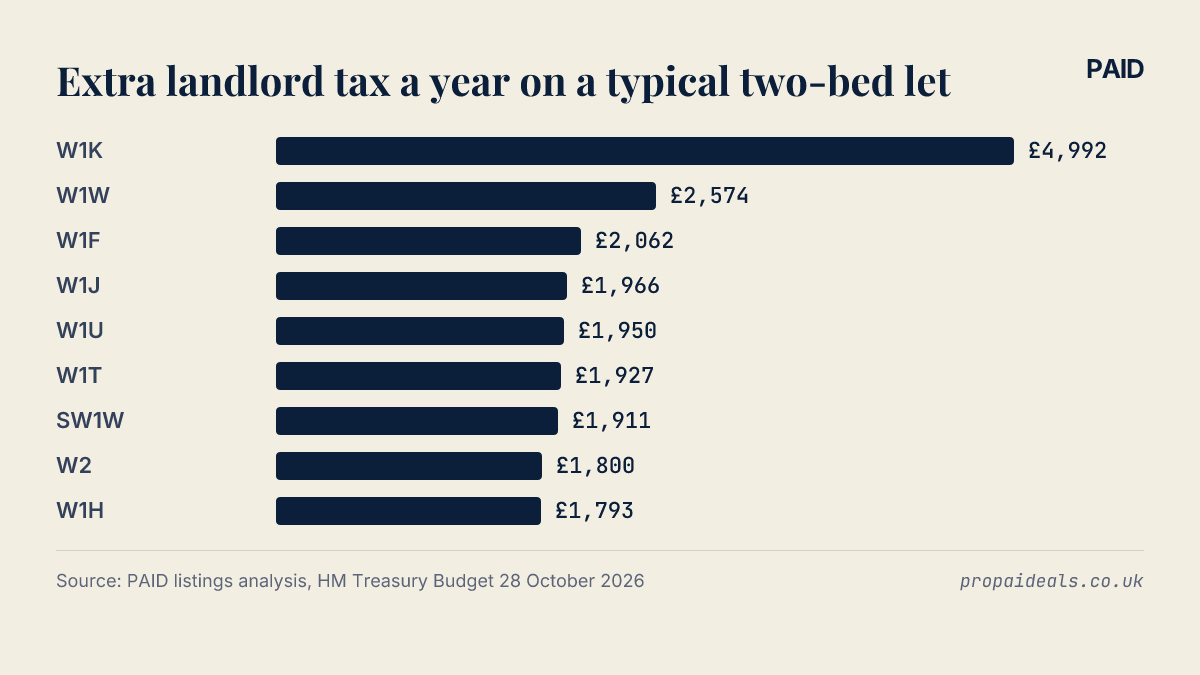
The cash cost follows rents, so central London leads by a distance. In W1K, in Mayfair, the typical two-bed asking rent is £13,867 a month and the extra tax comes to £4,992 a year. Every district in the table sits in the West End or close to it.
| Rank | Outcode | Area | Typical two-bed rent a month | Extra tax a year | Rent listings |
|---|---|---|---|---|---|
| 1 | W1K | Mayfair | £13,867 | £4,992 | 80 |
| 2 | W1W | Fitzrovia | £7,150 | £2,574 | 25 |
| 3 | W1F | Soho | £5,728 | £2,062 | 22 |
| 4 | W1J | Mayfair and St James's | £5,460 | £1,966 | 73 |
| 5 | W1U | Marylebone | £5,417 | £1,950 | 63 |
| 6 | W1T | Fitzrovia | £5,352 | £1,927 | 41 |
| 7 | SW1W | Belgravia and Pimlico | £5,308 | £1,911 | 36 |
| 8 | W2 | Bayswater and Paddington | £5,000 | £1,800 | 808 |
| 9 | W1H | Marylebone | £4,981 | £1,793 | 54 |
City by city
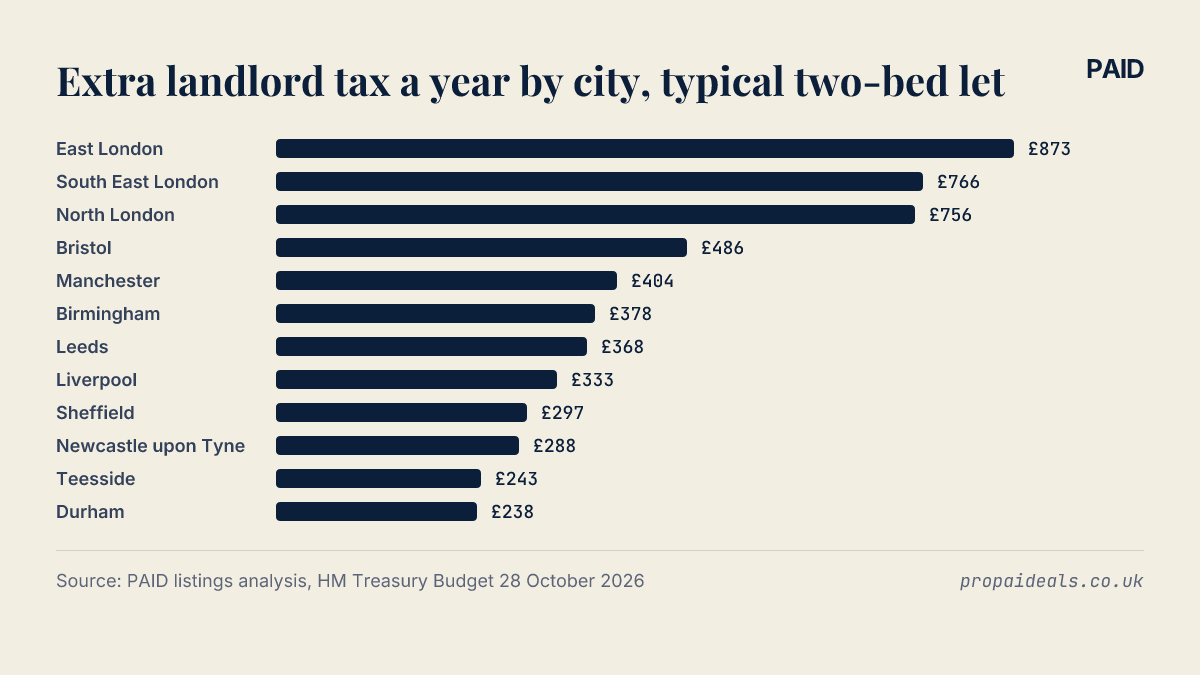
Outside London the figures shrink quickly. Across the East London postcode area the typical extra tax is £873 a year. In Bristol it is £486, in Manchester £404, in Birmingham £378 and in Leeds £368. At the low end, a landlord with a typical two-bed in the Durham area pays £238 more.
| Area | Postcode area | Districts | Typical two-bed rent a month | Extra tax a year |
|---|---|---|---|---|
| East London | E | 20 | £2,425 | £873 |
| South East London | SE | 28 | £2,128 | £766 |
| North London | N | 23 | £2,100 | £756 |
| Bristol | BS | 29 | £1,350 | £486 |
| Manchester | M | 39 | £1,122 | £404 |
| Birmingham | B | 38 | £1,050 | £378 |
| Leeds | LS | 29 | £1,022 | £368 |
| Liverpool | L | 31 | £925 | £333 |
| Sheffield | S | 41 | £825 | £297 |
| Newcastle upon Tyne | NE | 36 | £801 | £288 |
| Teesside | TS | 26 | £675 | £243 |
| Durham | DH | 8 | £662 | £238 |
How the rise applies in the other nations
The new rates cover Wales, although the Welsh Government has been given the power to set its own property income rates. The typical two-bed rent across Welsh districts is £850 a month, which puts the extra tax at £306 a year if the UK rates apply in full.
Scotland sets its own income tax rates, so these figures do not apply there. Northern Ireland is covered by the new rates but is not part of this analysis.
What the figures leave out
These are illustrations, not tax bills. Real costs vary a lot from one let to another, and asking rents are what landlords are advertising now, not what tenants will pay in April 2027.
Landlords with a mortgage face different sums, because mortgage interest is relieved through a separate tax credit. Landlords who hold property through a limited company pay corporation tax on their profits, so this change does not apply to them.
For more on rents and yields by area, see our guides, or browse investment properties with rent and yield data attached.